

Before we dive into this section you should remind yourself of what phases mean as outlined below.
The concept of phase difference, is expressed in degrees and that a full cycle is equal to 360 degrees.
The word phase is used in the context of the waveform to mean an amount of time. The amount of time to do one complete cycle is 360 degree and half a cycle 180 and so on.
As well as measuring time in seconds it is also referred to as so many degrees. Have a look at the diagram below. Note the progression rotates anticlockwise.
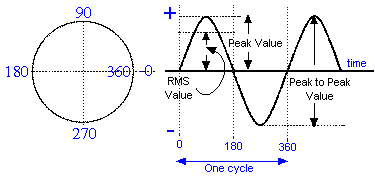
You can see that there are markings at the bottom of 0 - 180 - 360 which are measurements in degrees. There are 360 degrees in a circle (see diagram above) just as there are in one cycle of the sine wave.
If two sine waves are on the same diagram but start and finish at different places the time difference between them can be expressed conveniently as a phase angle.
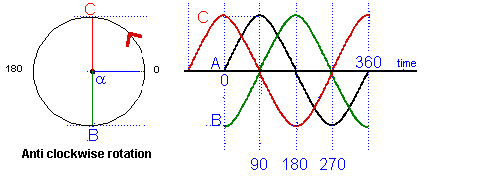
NOTE: that the circle on the LEFT denotes rotation ANTICLOCKWISE.
The amount that a curve lags or leads is given in degrees
according to where the same point on the first curve the
second one is. In the diagram above you can see that the
angle ![]() = 90o so
by using the circle you could assess the amount of lead or lag
in degrees.
= 90o so
by using the circle you could assess the amount of lead or lag
in degrees.
From the point of view of the sine wave "A" at point 0o, the wave form "C" is leading wave "A" by 90o. If you look at the diagram above "C" as it was at the same point on the time line 90o earlier than "A".
Where as wave "B" lags wave "A" by 90o as it has not yet reached the point on the time line where "A" is at 0o.
All the waves "A", "B" and "C", above, are said to be "out of phase".
When trying to assess the amount of out of phase, the leading or lagging of one wave form to another you have to assess the location of the peaks that will indicate to you which wave form is ahead or behind and then consider where they respectively cross the ZERO line as here you will be able to use the graticule to count up the number of degree lag or lead.>
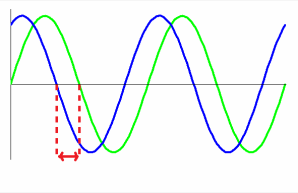
In the diagram above the blue wave form is leading the green wave form and the amount of the lead would be assessed on the zero line where the two dotted red line indicate.
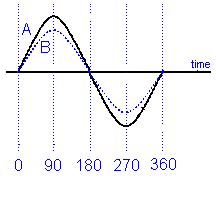
If two curves start and finish at the same time even though they have different magnitudes they are said to be "in phase".
AC waveforms drawn graphically are known as vectors. When we compare 2 or more vectors in a chart it is known as a phasor or phasor diagram.
This rather confusing concept when understood will make the next part much more understandable.
3M1 Recall that analogue and digital signals are transmitted by some form of amplitude and/or frequency/phase modulation.
In its simplest form a transmitter's RF signal (carrier) is keyed on or off, giving Morse code.
However if the RF signal is modulated by a single tone then you have a real signal in the form of a sine wave.
If the RF signal (carrier) wave form is modulated by audio tones then an AM signal results.
If one side of the AM signal is filtered out (removed) you have USB or LSB with the carrier, but usually the carrier is also filtered out (suppressed).
Similarly with FM (or Phase modulation) it just treats the carrier differently with an audio signal modulated (imposed) upon it.
Recall that amplitude and frequency/phase modulation can be portrayed on a phasor diagram.
A phasor diagram is a way to show a rotating vector, also know as a “Phasor” as a line whose length represents both magnitude (“peak amplitude”) and direction (“phase”) which is “frozen” at some point in time.
The phasor diagram in  Page 67 is used to visually represent the single
carrier audio tone modulating (or changing) into an RF carrier
for USB or LSB, with one sideband rotating in one direction
while the other sideband rotates in the other, all
at 1 revolution per second. The sum of all three
vectors will stay horizontal but can get longer or
shorter giving us the AM signal amplitude.
When the carrier is rotated by 90 degrees leaving the
original sidebands as they were it gives us narrow
band modulation, the sum of these vectors now
moves left to right before rotating again at one
cycle per second this movement to the left
(anti-clockwise) gives us decreasing frequency and
to the right increasing (clockwise). With narrow
band the left to right movement is so small as to
hardly affect the amplitude. This will give us a
second Phasor diagram as shown in  page 68 Fig 10.3 .
Understand that to fully capture the information in the amplitude and phases of the signal that the position of the phasors must be resolved as the values on two axis at right angles.
Please note that the phasors are at right angles but not as you would understand the E (Electrical) and M (Magnetic) waves from an antenna.
If you look at the drawings in  page 68, diagram 10.3, they each have
two axes at right angles. The four axes lines represent the phase,
think of the angles between the axes as angles round a circle - so
each axis is 90 degrees apart. The dots represent the signal
at a moment in time, and the distance of the dots from the
centre represents the amplitude.
In drawing A, the two dots are on the same axis, so the two signals are in phase but because they are different distances from the centre, they are of different amplitude.
Drawing B shows two dots which are equidistant from the centre (so the same amplitude) but on opposite axes, so 180 degrees apart in phase.
In Drawing C we see four points the same distance from the centre, so the same amplitude, but each 90 degrees apart from their neighbours.
So - what does this mean in the context of the 3M1 item? We have seen that the drawing lets us express simply both the amplitude and phase relationship of different signals.
3M2 Recall that mixing the RF of IF signal with two local oscillators signals 90 degree different in phase will produce an in-phase (I) and quadrature (Q) component which can be digitised allowing all forms of modulation to be demodulated entirely by mathematical processes in a PC or using dedicated hardware.
So what are the I and Q components? The term “I & Q” are abbreviations for “in-phase (I) ” and “quadrature (Q).” We have already talked about “in-phase” which is a relative position along a time line and we have established that a sine wave can only be “in phase” or “out of phase” by reference to another sine wave signal.
So what about “quadrature” ? It has no meaning on its own but a pair of sine wave signals are said to be "in quadrature” when the two signals differ in phase by 90 degrees ( a quarter of a cycle hence Quadrature ). So instead of having two signals called I1 and I2 we have one called I and the other one called Q which stands for quadrature. Or put it another way and more technically, “in-phase” I and “quadrature” Q refer to two sine waves that have the same frequency but are 90° out of phase. In the technical world the I signal is designated as a cosine waveform, and the Q signal is designated as a sine waveform.
So now for an explanation on a cosine waveform, and a
sine waveform. A cosine wave and the sine wave
must have the same frequency,
with the cosine wave form leading the sine wave form by 90
degrees of phase.
We have seen this diagram before, further up this page but
with the B wave removed
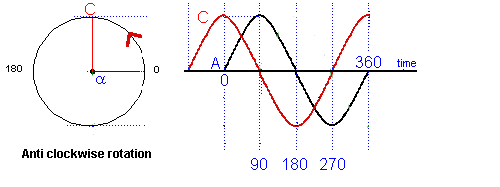
Looking at wave forms C and A. We know that waveform C is leading wave form A by 90 degrees so the wave form C is called the the "cosine wave form" as it lead the waveform A by 90 degrees and thus the A is called the "sine wave form".
Thus in practice, a single cosine wave is the same as a single sine wave. The "phase" relationship is only appropriate when we are comparing two waveforms having identical frequencies.
Remember that I and Q signals are always amplitude-modulated, not frequency-modulated or phase-modulated.
Looking in  section titled “SDR Receiver Architecture” Page 68 there is
mention of the I and Q terms, and how mixing a signal with
two local oscillators 90 degrees out of phase provides an IF
which can be converted in the ADC to give the I and Q outputs.
The most common option used in an SDR receiver architecture (software design) is to mix two local oscillator signals internally one at 90 degrees different in phase to the other, then the resulting signals can be fed into two ADC or analogue to digital converters which output the I (in-phase) and Q (quadrature) channels for further processing to take place by the processor.
The faster the processor within the SDR unit, the more bits of data collected gives a better spread of the band in MHz.
It is now possible to capture the entire HF band in one go !
Recall that this technique is the basis of SDR (software defined radio) receivers.
The technique is the mixing of 2 local oscillator signals, one with a 90 degree phase change, to produce signals that can be digitally processed by the ADC to create the I and Q signals to be used in a processor or computer allowing analogue to digital conversion and demodulation and thus output suitable audio and data signals.
Recall that these techniques can also be used to create complex modulations for use in transmitters.
The technique of the mixing of 2 local oscillator signal, one with a 90 degree phase change, to create complex modulations for use in transmitters. Such Complex Modulations are, for example, used in the quadrature phase-shift-keying (QPSK) modulation process, including the I and Q signals as well as the RF carrier signal.
Recall that if sampling is carried out directly on the RF signal the extraction of I and Q components and subsequent demodulation may be carried out entirely by mathematical processes.
Check out the diagram below which you saw earlier. There you can see how the I and Q signals are recovered.
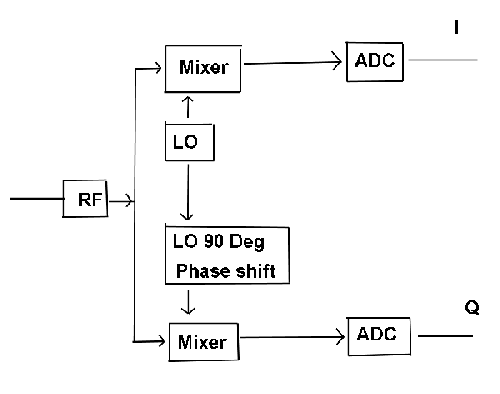
By using 2 local oscillator signals of a set frequency BUT at 90 degrees different in phase to each other, we can then feed them into two ADC or analogue to digital converters and thus digitally process and demodulate.
The SDR terms for this process is called " I (in phase) and the Q (quadrature) corresponding to two directions be it E-W or N-S ".
Note with faster processors or computers a far higher sample rate can now be achieved, in some cases the processor is quick enough and the need for a computer is no longer required.